What is an image histogram?
An image histogram is a graphical representation of the distribution of tones in said image. The information is typically expressed as a bar graph showing the percentage of the image that is exposed at a certain brightness value. The histogram starts with black on the left side of the graph and goes up to whites on the right side of the graph.
Where can you find histograms?
Histograms can be found in a variety of programs, not just in your camera. Most image editing programs like Photoshop (used in my examples) have a histogram. Even when editing it can be a useful tool to help you nail down the perfect look for the image.
In ILC cameras you can usually find histograms available as an option for the rear screen. Depending on what kind of camera you have you might only have the option to display a histogram for an image when reviewing images. On more modern cameras like my Canon 6D II you can view a histogram of the current exposure when using the live view. This can obviously be a nice way to check if a sky is blown out or not rather than trying to eyeball it.
What is the histogram for?
The histogram is useful because it can tell you where the main part of your exposure lies either underexposed on the left or over exposed on the right. It’s true that you can make this out for yourself by reviewing the image, but even so the histogram is going to give you more information that you can use to validate what you’re seeing with your eyes.
If for instance you’re on a studio shoot the histogram is a great way to back up what you’re seeing on the monitors. If your clients are paying thousands for a shoot it’s a good idea to have some objectivity in your workflow and histograms provide that. Do you think major companies want photographers to eyeball the exposure for photos that will be used in million dollar ad campaigns?
What is good exposure?
Good exposure is something different than you might think. It’s not just getting an image that looks ok. “The image looks ok” is a subjective evaluation. Whereas “the histogram looks ok” is an objective evaluation. So what you should generally try to do is fill the histogram. Filling the histogram means there is data in the histogram going from the furthest left to the furthest right, or the blackest blacks to the whitest whites.
Example histograms
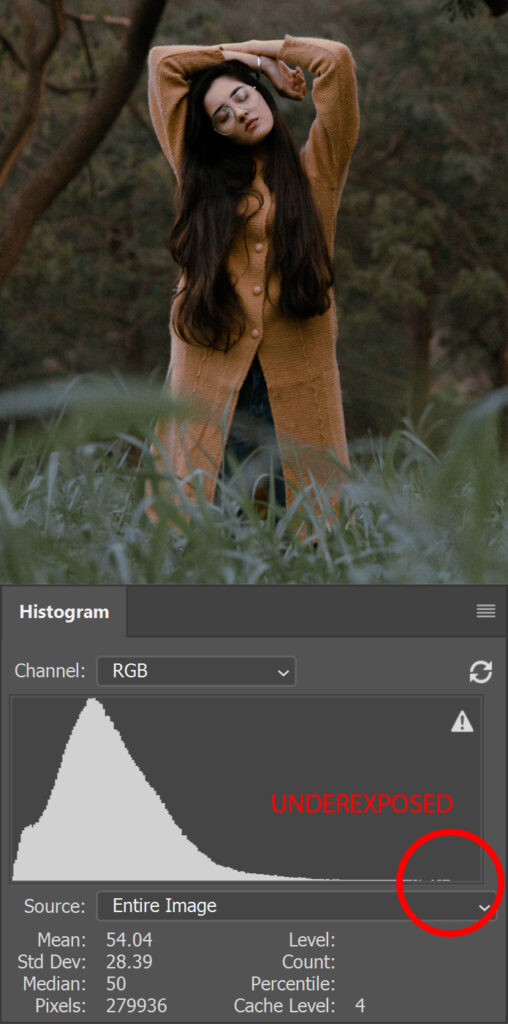
In the image below everything looks ok to the eye, but the image is actually underexposed by one stop. You can see this by looking at the far right side of the histogram circled in red. There is no data in the histogram at the far right of the graph.

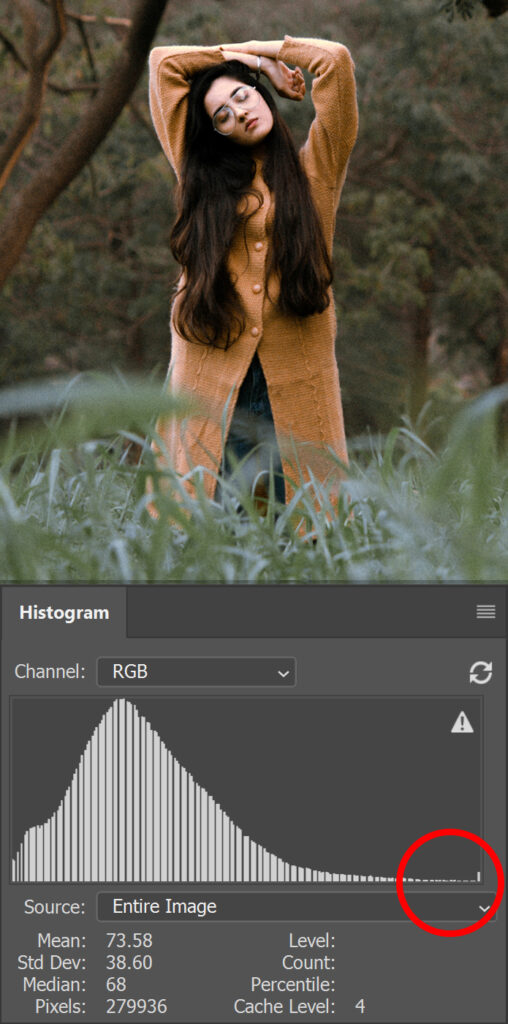
In the next image I adjusted the exposure +1 stop in Photoshop. Now you can see in the circled area that the histogram is just barely touching the far right of the graph, which is closer to how you would want to expose this image in the first place.

Final thoughts
I don’t really use histograms a lot but I’m going to start checking my exposure with the in camera histogram to objectively validate my camera settings. How important are histograms in your workflow? Let us know your thoughts in the comments below.

